Identify truck charging needs 2030
Note: This flow is momentarily only available for Belgium.
Note: Consult all the details of the methodology in our technical report.
You will find multiple layers within your ChargePlanner application providing insights into the market space for slow, fast & ultrafast truck charging. In general, the following steps need to be followed:
1. Make sure you see the data you want to see
2. Consult map layers
3. Click on an individual zone to see more details
4. Make an Excel export and analyse further
1. Make sure you see the data you want
- Go to marketing efforts
- Click on 'clear all settings'
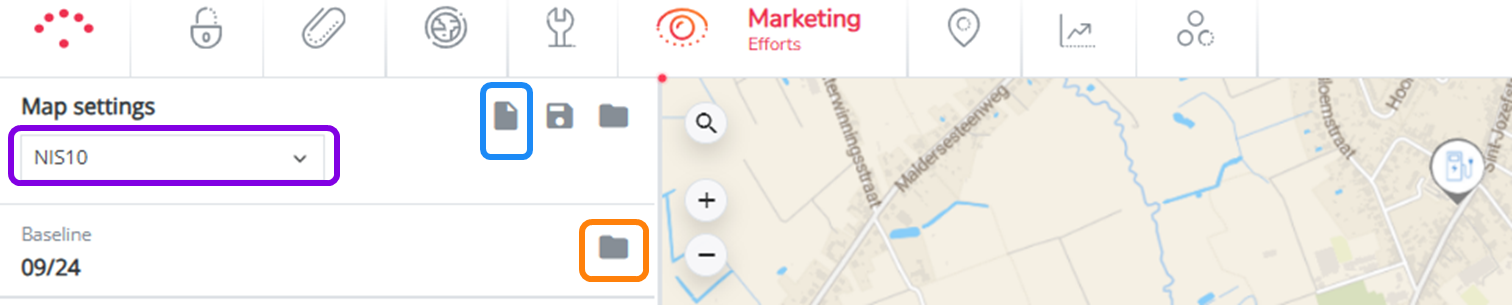
- Choose your aggregation level: on which zone level do you want to see the results?
- Select the period for which you want to see the data (typically the most recent data)
2. Consult map layers
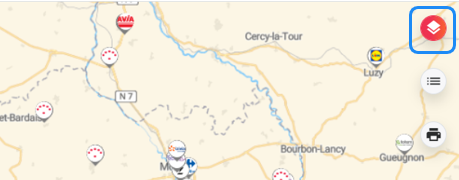
Click on map layers at the upper right corner
Here you see all the relevant layers and select them:
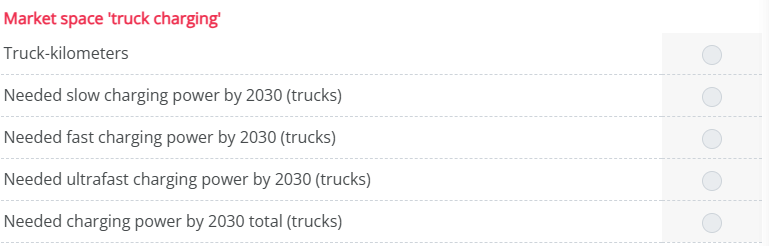
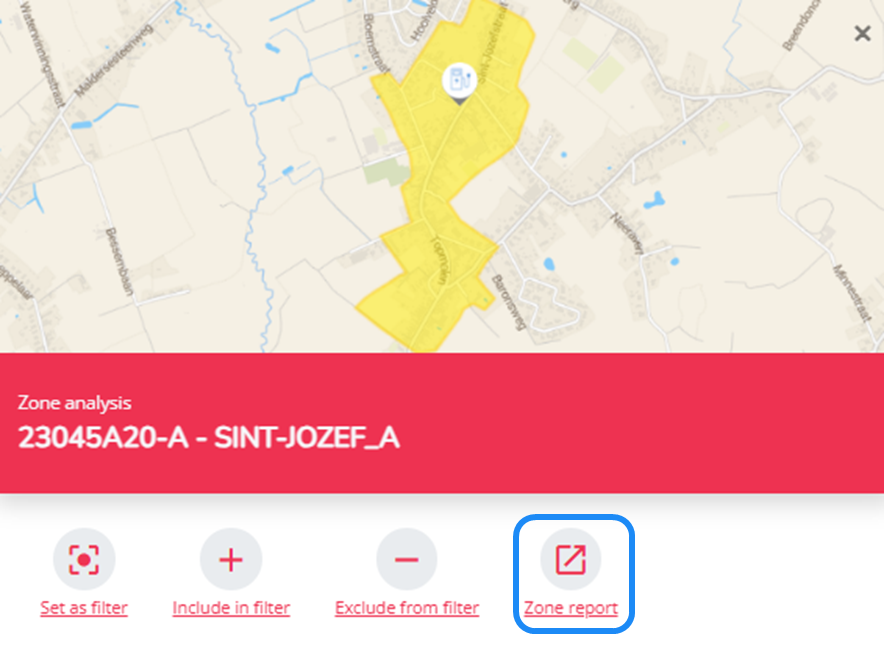
3. Click on an individual zone to see more details
You can always click on an individual zone on the map to see the different elements specifically for that zone.
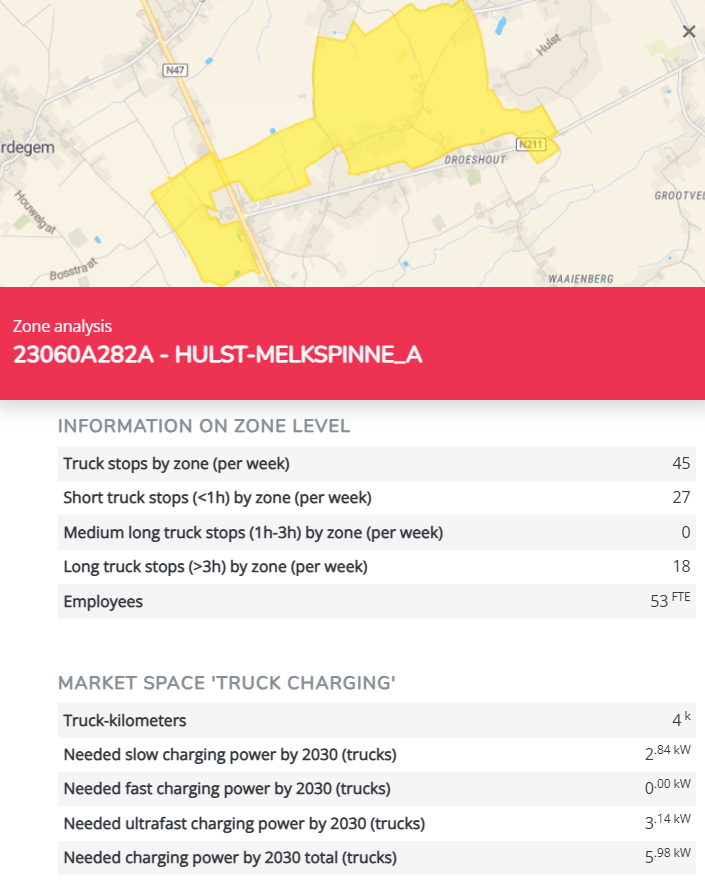
Consult the zone report to see even more details.
4. Make an Excel export
If you want to do further analysis in Excel, you can export all this information.
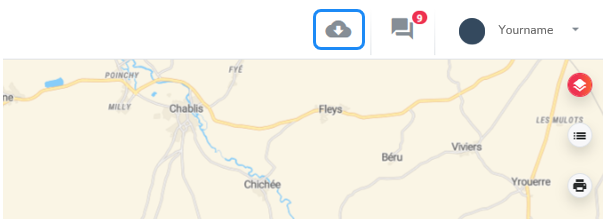
Click on ‘Export to Excel’ at the upper right corner of your application (while still in the Marketing Efforts module).
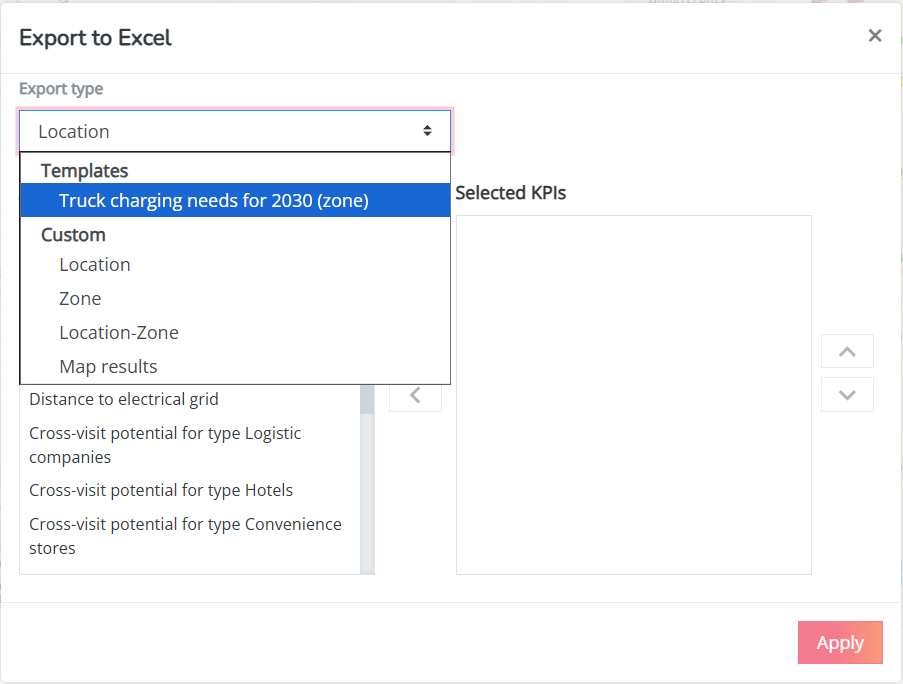
Select template ‘Truck charging needs for 2030 (zone)' & click apply.
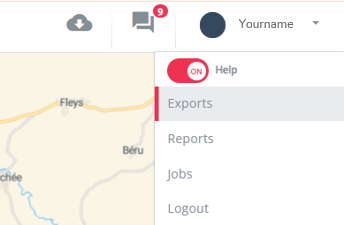
Click on your user on ‘Exports’.
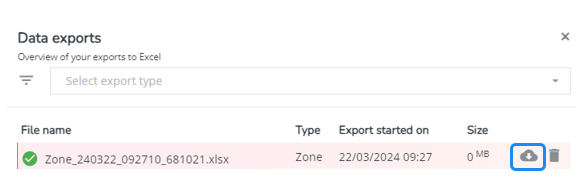
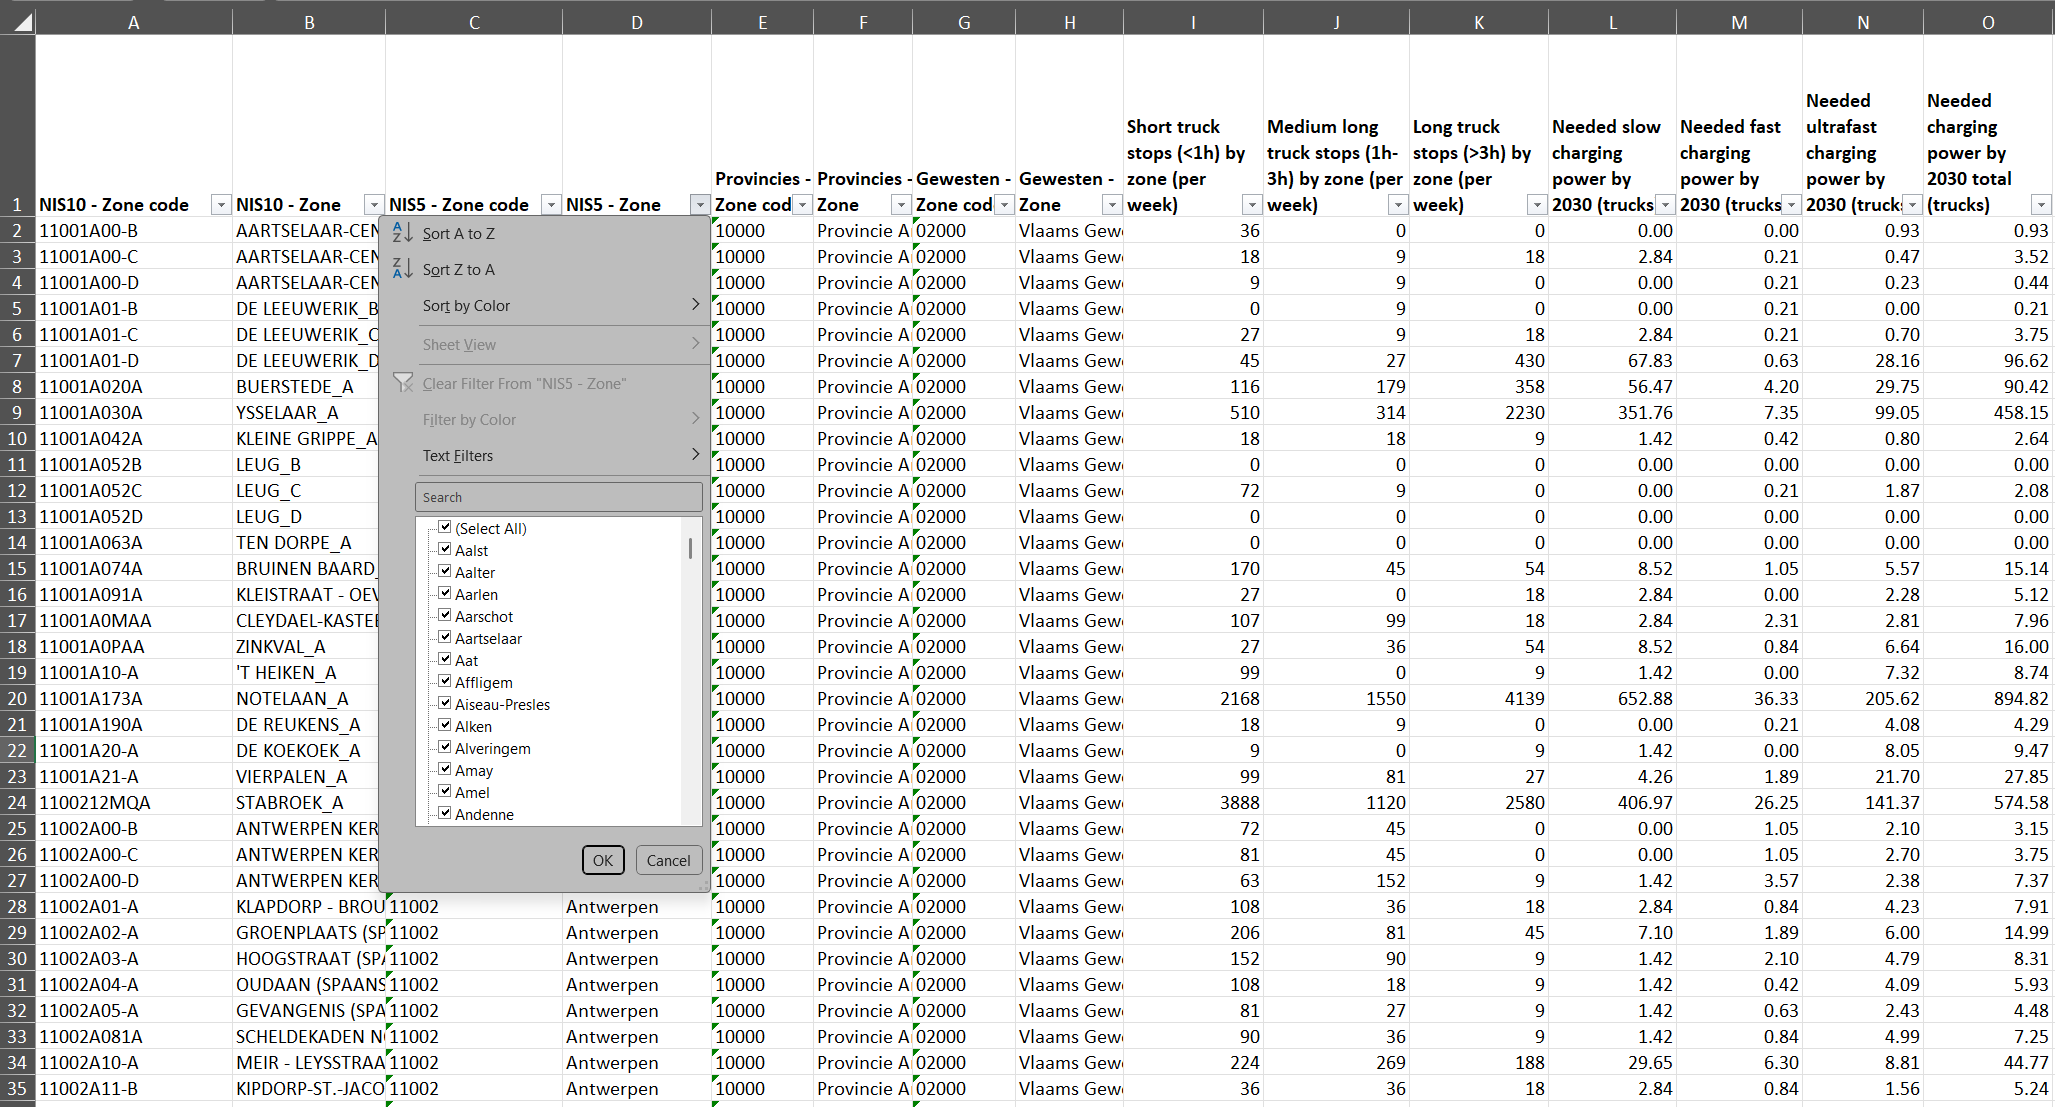
Download the Excel file with information & dive deeper. You can filter on a certain aggregated zone if you want to limit your analysis to a certain geographical area.
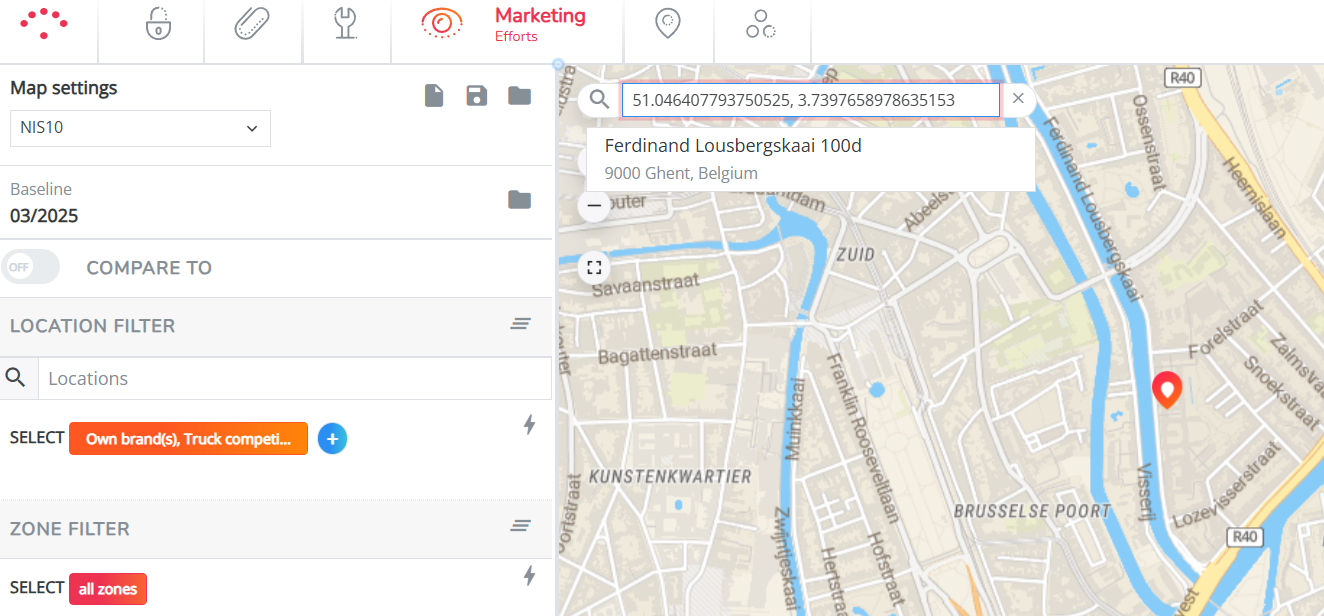
Find your zone easily on the map: The easiest way to do so is by filling in the geographical position with latitude and longitude in the searchbar on the map.