
How to analyze interesting retail areas
When expanding your EV charging network, understanding where people go, how long they stay, and why they visit is essential.
The Shopping Area Dashboard & Footfall layer can give you a clear picture of human movement and commercial activity around key locations, helping you identify high-potential areas for your next charging points.
Displaying shopping areas (Belgium only - but will be rolled out for other countries soon)
Explore the shopping areas RetailSonar tracks through an intuitive, detailed dashboard:
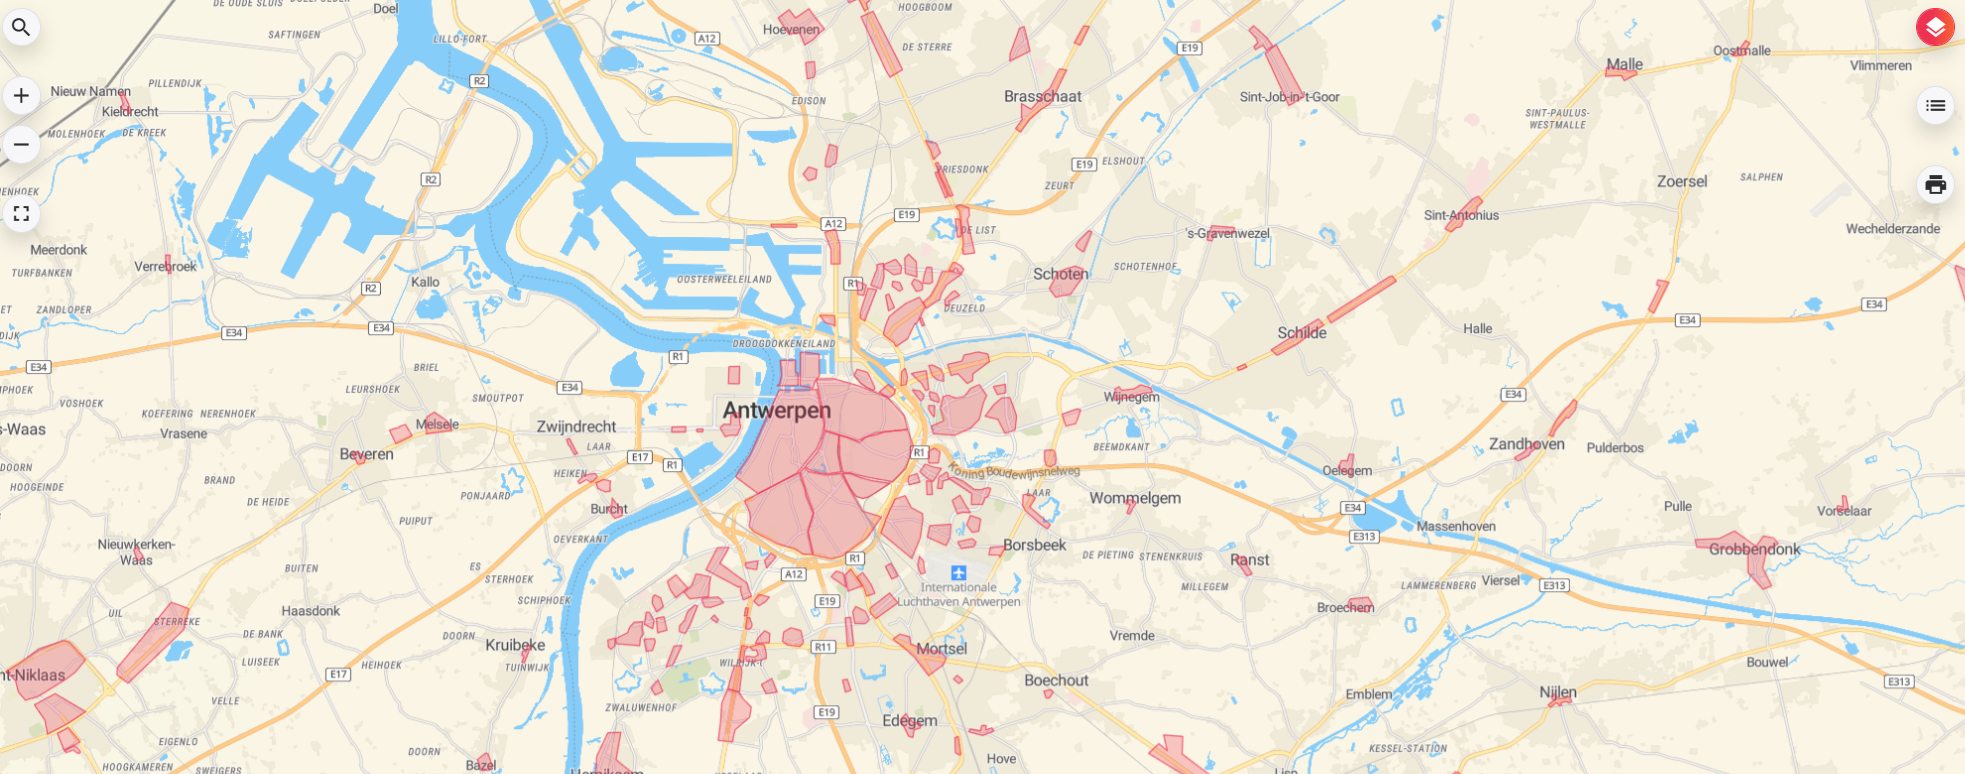
- Open Map Layers
- In Areas of Interest, toggle Shopping Areas on
- The map updates to show the shopping areas of the country with at least 1750 weekly visits. Click any shopping area to open its dashboard for deeper metrics and comparisons.
Dashboard overview
1. Core Metrics
The top section of the dashboard provides key performance indicators for the selected shopping area. These help understand visitor behavior using the available data.

These KPI's are further explained within different tabs, which is discussed below.
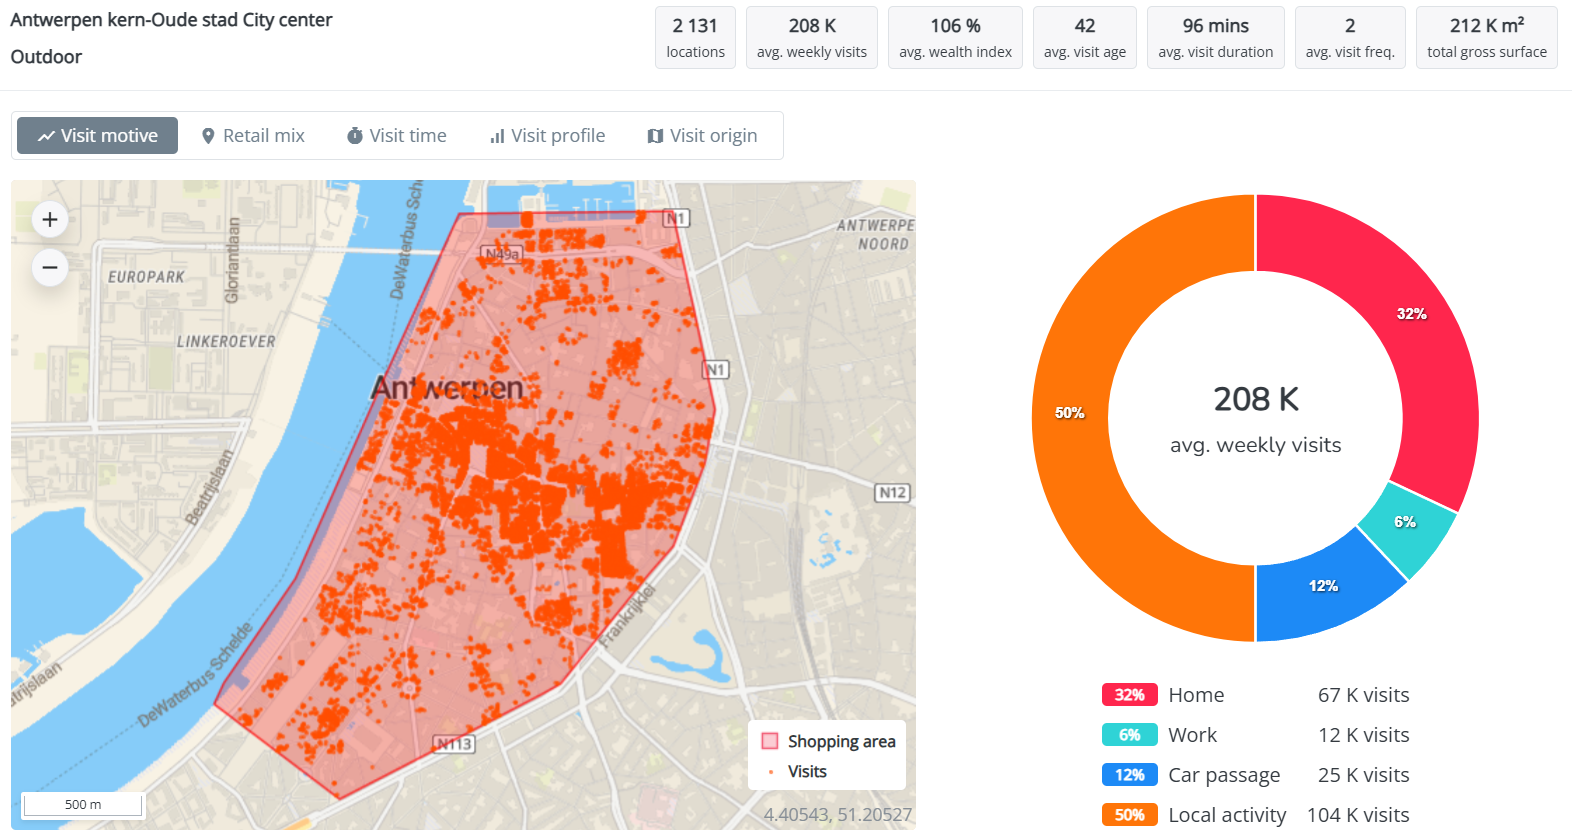
2. Visit motive
The Visit motive tab provides insights into why customers are visiting the selected shopping area, which help understand the underlying reasons for customer traffic. It breaks the average weekly visits down in four categories:
- Home: Visits made by people coming or heading to their homes
- Work: Visitors arriving from or going to their workplaces
- Car passage: Visits associated with accidental passers-by traveling between other destinations
- Local activity: Visits associated with other nearby points of interests (e.g. other stores or restaurants)
The map displays all visits within the shopping area, allowing you to easily identify where the highest levels of activity or “busiest spots” are located.
Note: Indoor shopping areas like shopping centers are marked as 'Indoor'.
3. Retail mix
The Retail Mix visualizes the brands and sectors present in the area, showing their size, gross surface and weekly visits. You can filter or sort the brands by selecting the icons 
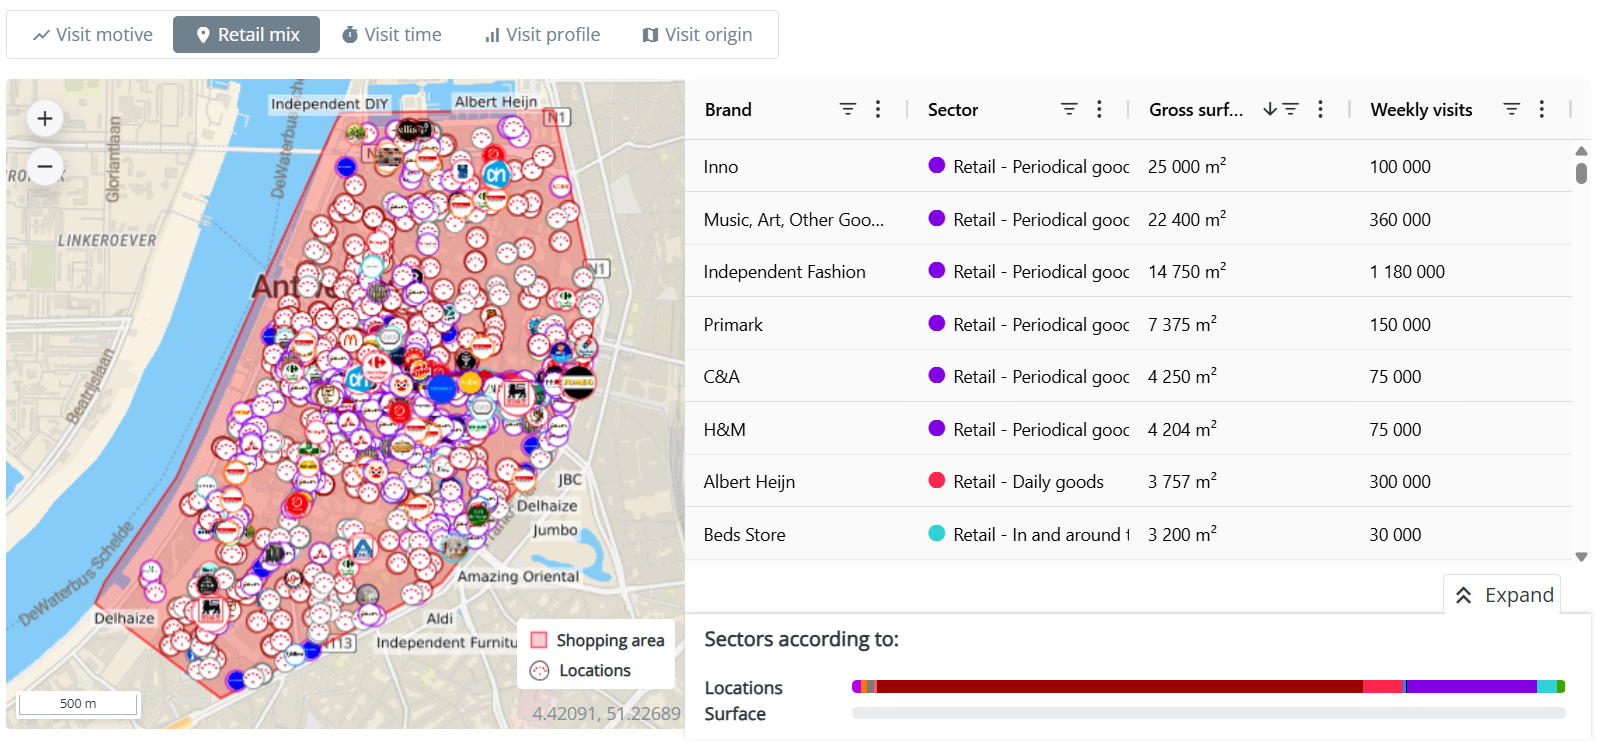
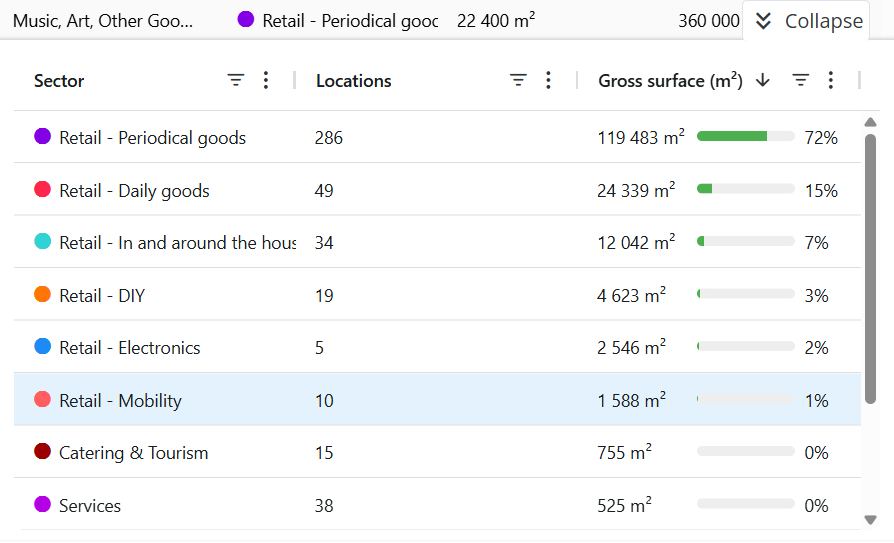
At the bottom, an expandable menu shows the sector distribution, categorized by location and gross surface area, offering deeper insights into the area's retail composition.
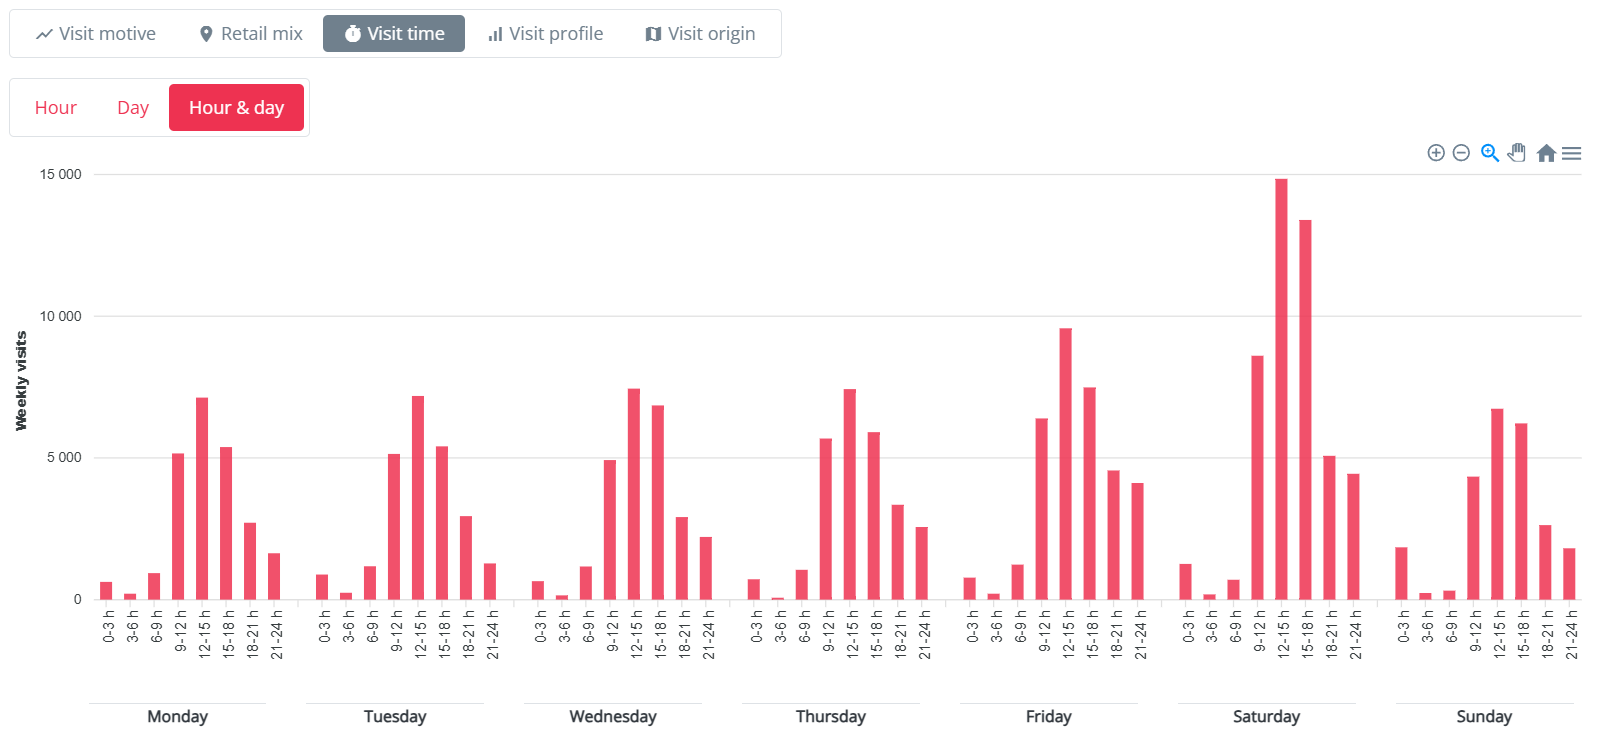
4. Visit time
The Visit time tab displays the number of visits by hour, day or both combined, allowing to identify peak periods. When moving your cursor over the bars, the actual number of visits is shown.
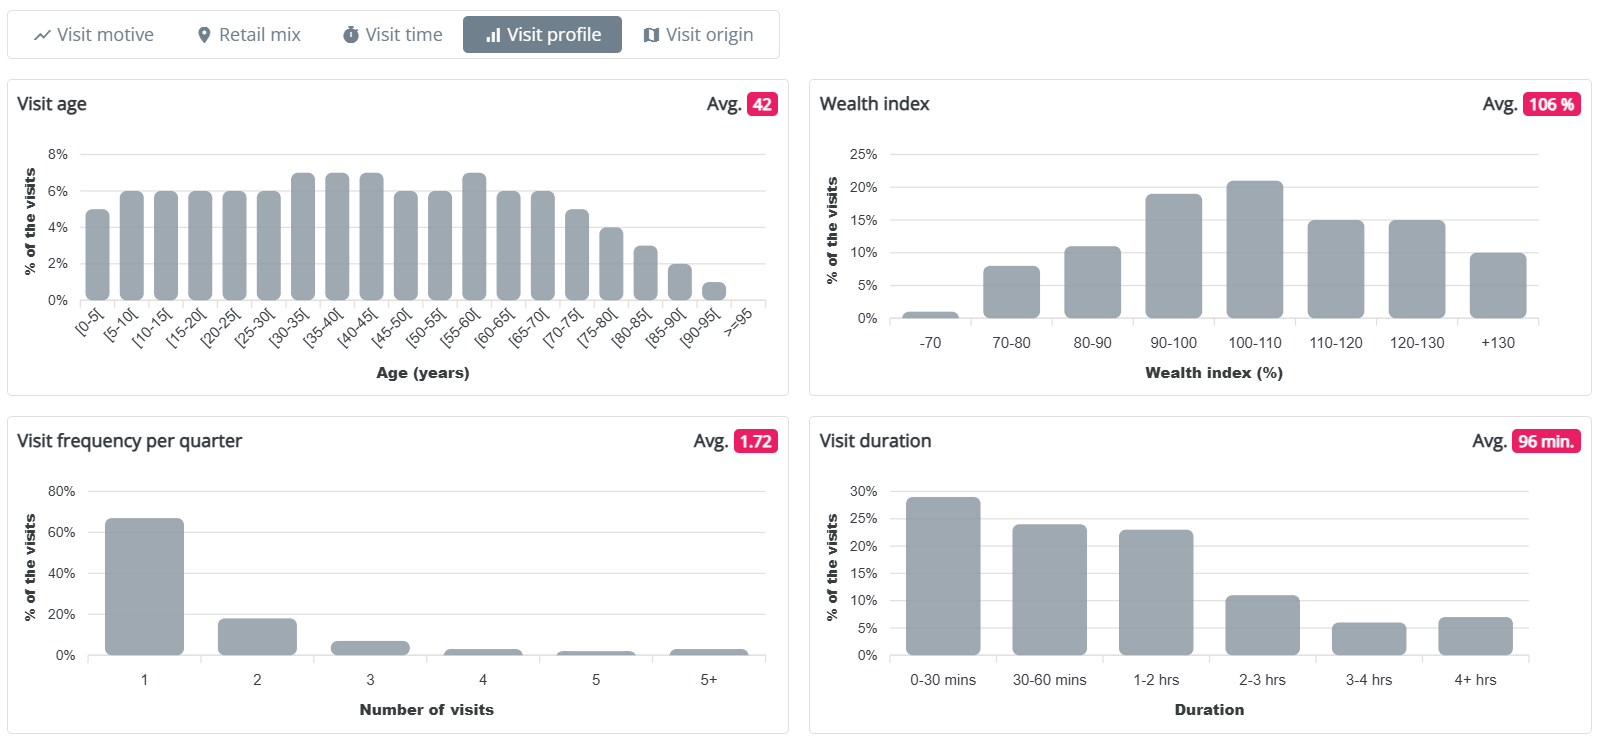
5. Visit profile
The Visit profile describes the shopping area's visitor characteristics: age mix, wealth index, quarterly visit frequency, and average time spent in the area. This gives insight into the profile of visitors (in terms of age and wealth index), how often they return, and how long they stay.
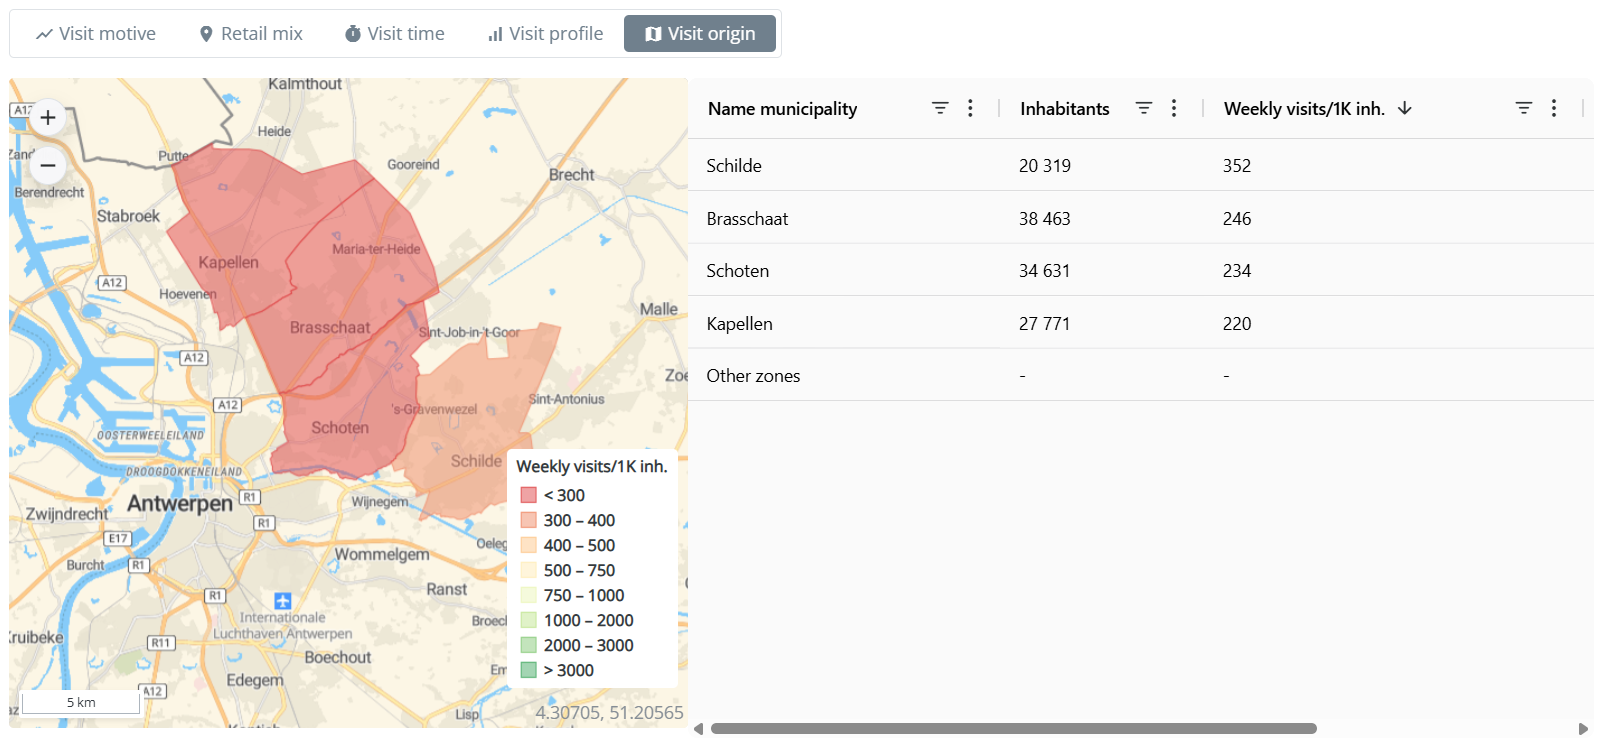
6. Visit origin
The visit origin tab features a map showing the catchment area based on home addresses at the municipality level (NIS5). For each municipality, details such as inhabitants, the weekly visits per 1000 inhabitants originating from that area, and the proportion of the total visits contributed by each municipality are provided. Municipalities with only a small number of visits are grouped into 'other zones'. You can filter or sort the municipalities by selecting the icons
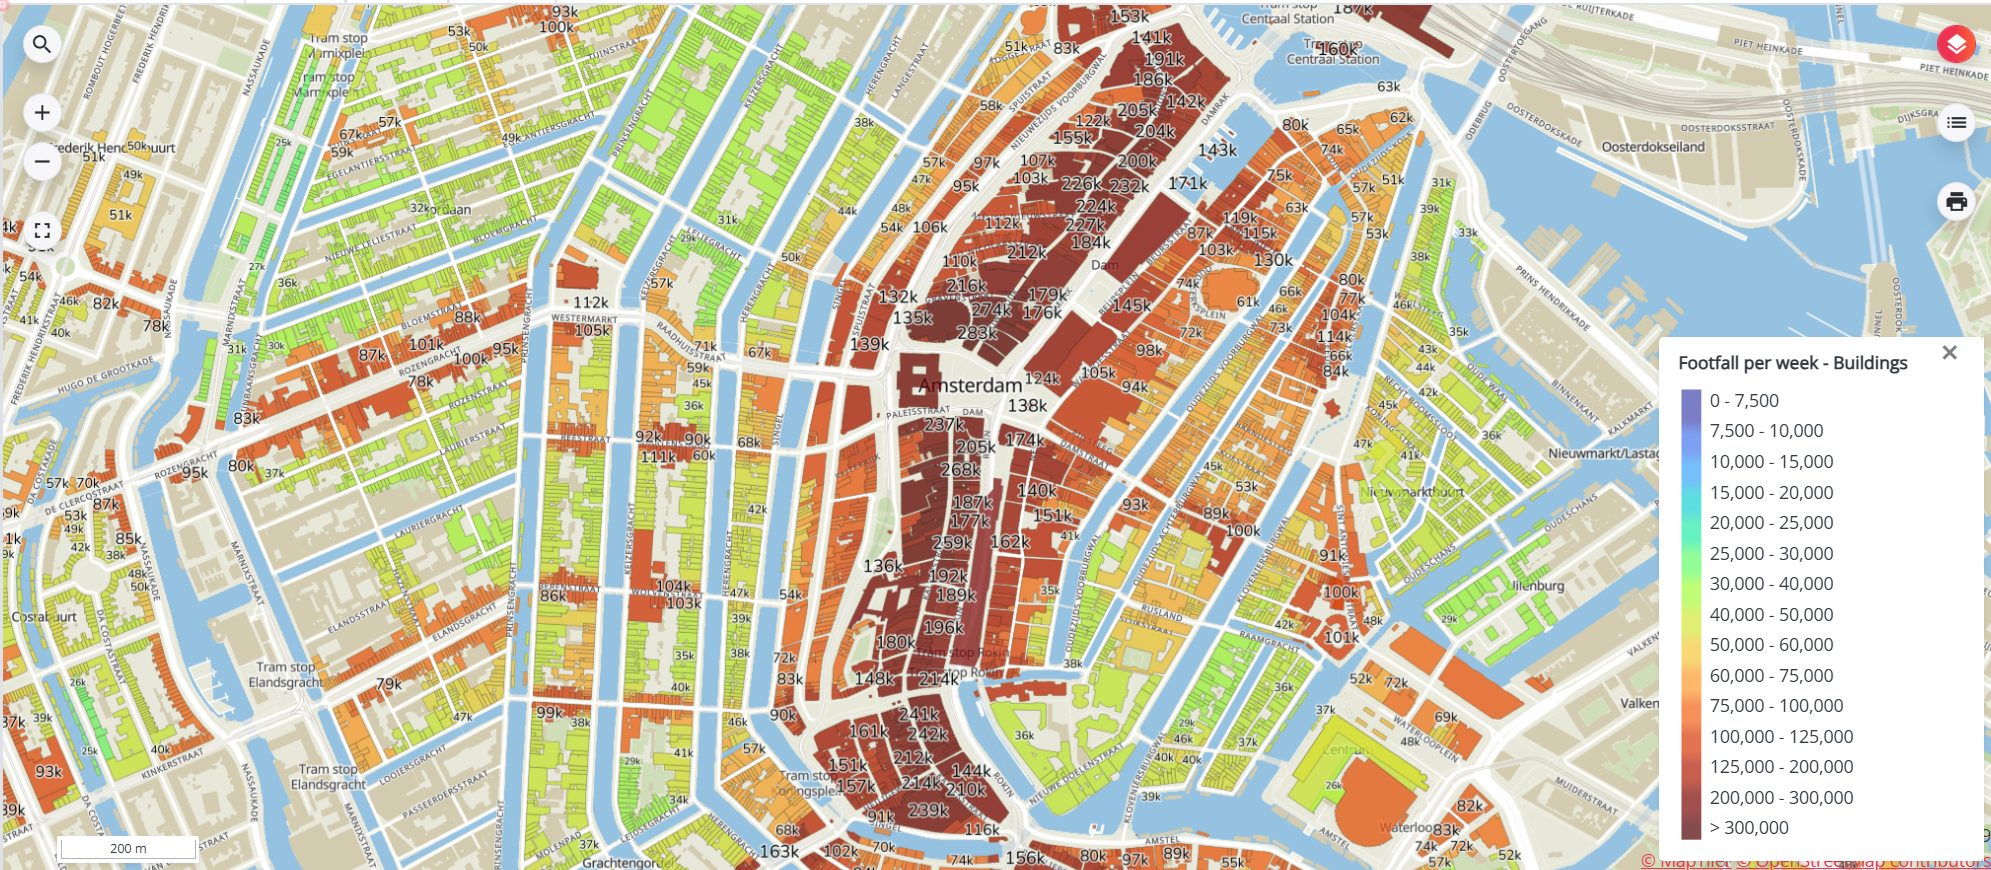
Displaying a footfall layer
Footfall volume is a location characteristic and represents the visibility of a location to the people passing by on foot. For each location, the main roads from which the location is visible are determined and account for the relevant passage. The footfall layer can be enabled for both building level and road level.
Data pack
The footfall data covers a 12 month period. It is not part of a standard configured platform but can be implemented as an extra data pack. For more information about this data pack please contact support@retailsonar.com