
Detailed list of information in Optimize table
When you click on 'Table', you will see the results for each site in the list as well as extra information: Potential, # of electric cars, local activity, etc.
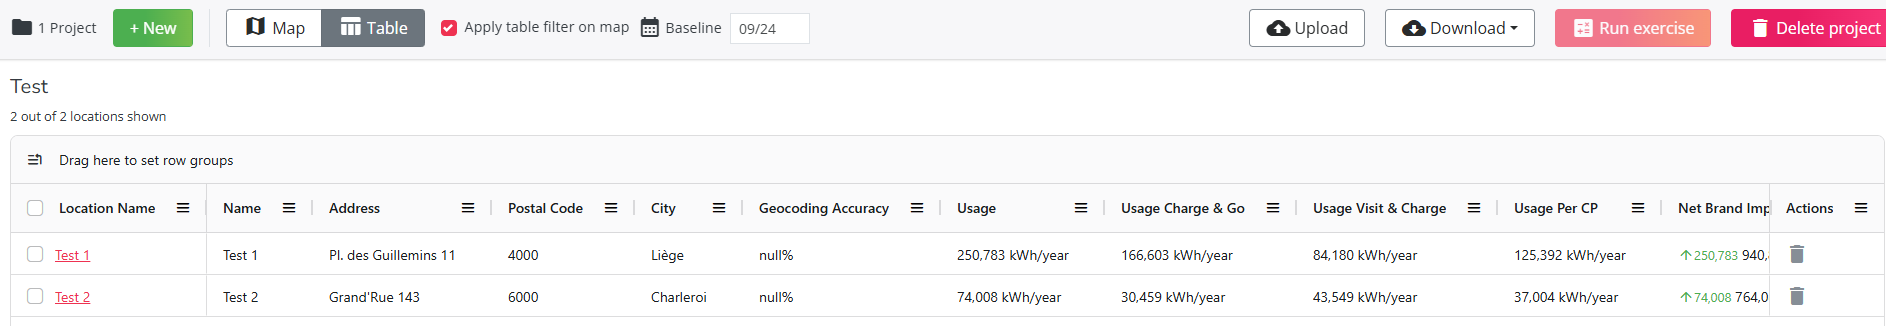
The table shows the list of all the tested locations together with the following information:
- Usage: Predicted annual usage in kWh/year for the charging location in total
- Usage Charge & go : Predicted annual usage in kWh/year for the charging location in this segment
- Usage Visit & Charge: Predicted annual usage in kWh/year for the charging location in this segment
- Usage per charging point: Predicted annual usage in kWh per charging point
- Net impact on brand: the net impact on the entire own brand (including cannibalization on other own locations)
- # UF charging points: Number of ultra-fast charging point(s) indicated in the project for each site
- # F charging points: Number of fast charging point(s) indicated in the project for each site
- # S charging points: Number of slow charging point(s) indicated in the project for each site
- Maximal power of the ultrafast charging points : Maximal power of all the ultrafast charging points of the site
- Average power of the ultrafast charging points : Average power of all ultrafast charging points of the site
- Maximal power of the fast charging points : Maximal power of all the fast charging points of the site
- Average power of the fast charging points : Average power of all fast charging points of the site
- Ad hoc price charging point DC : Price per kWh indicated for ultra-fast charging in the project
- Local activity <30min: Number of visits per year with a duration less then 30 minutes within a radius of 300m
- Local activity 30min-2h: Number of visits per year with a duration between 30min - 2h within a radius of 300m
- Local activity >2h: Number of visits per year with a duration >2h within a radius of 300m
- Car passage: number of cars passing by per week
- # UF charging points 3 mins: Number of ultrafast charging points within 3mins car drivetime
- # F charging points 3 mins: Number of fast charging points within 3mins car drivetime
- # UF charging points 10 mins: Number of ultrafast charging points within 10mins car drivetime
- # F charging points 10 mins: umber of fast charging points within 10mins car drivetime
- Developable public slow charging power own zone: indicates the slow charge power to be developed in the area, any negative number indicates that the estimated power for slow charge has already been reached and exceeded.
- Developable public slow charging power (6 min): indicates the slow charge power to be developed in the 6-min zones, any negative number indicates that the estimated power for slow charge has already been reached and exceeded.