
Identify charging needs for 2030
Depending on the country of the application you can follow a different flow to know the charging needs for 2030:
- If you are working on a non-Belgian platform, you can follow flow I. How to identify the charging needs for 2030 for slow charging.
- If you are working on a Belgian platform, you can follow flow II: How to identify the charging needs for 2030 for slow, fast, ultrafast and overnight truck charging.
Note: consult all the details of the methodology in our technical report.
I. How to identify the charging needs for 2030 for slow charging
The Stay & charge segment is drawn towards slow charging points. You will find multiple layers within your ChargePlanner application providing insights into the market space for slow charging. In general, the following steps need to be followed:
1. Make sure you see the data you want to see
2. Consult map layers
3. Click on an individual zone to see more details
4. Make an Excel export and analyse further
TIP: take a guided tour through the platform to familiarize yourself with this information. You can access the tour through the helpcenter button.
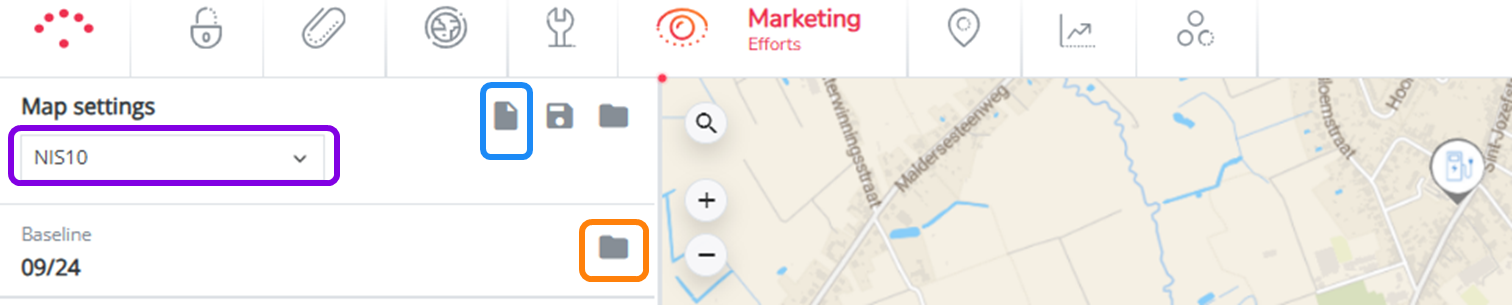
1. Make sure you see the data you want
- Go to marketing efforts
- Click on 'clear all settings'
- Choose your aggregation level: on which zone level do you want to see the results?
- Select the period for which you want to see the data (typically the most recent data)
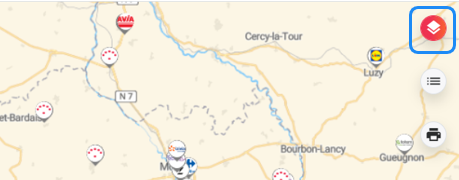
2. Consult map layers
- Click on map layers at the upper right corner
Here you see two relevant layer groups for slow charging:
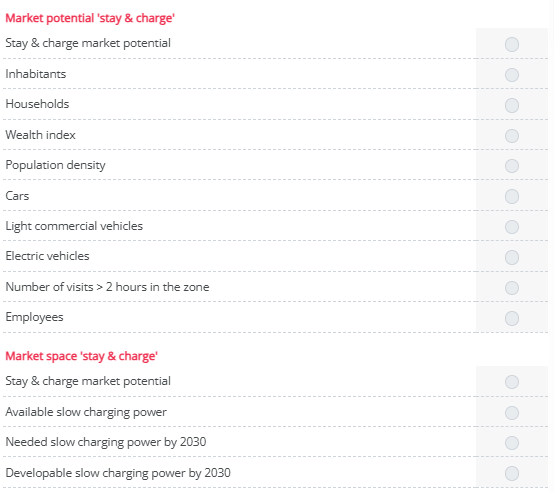
1. Layer group: ‘Stay & charge market potential'
Here you can select several map layers that play a role in the market potential for slow charging (for example #EVs) as well as the actual market potential per zone. If you don’t know what a layer means, hover over and/or click on the layer for more explanation
2. Layer group: ‘Stay & charge market space’
Here you can select the elements that are part of the market space calculation.
‘Developable slow charging power by 2030’ gives you a map that shows how much charging power can still be developed in each zone.
TIP! If you want more information about the details of these calculations, please consult the technical report that was presented and sent to you by our project team
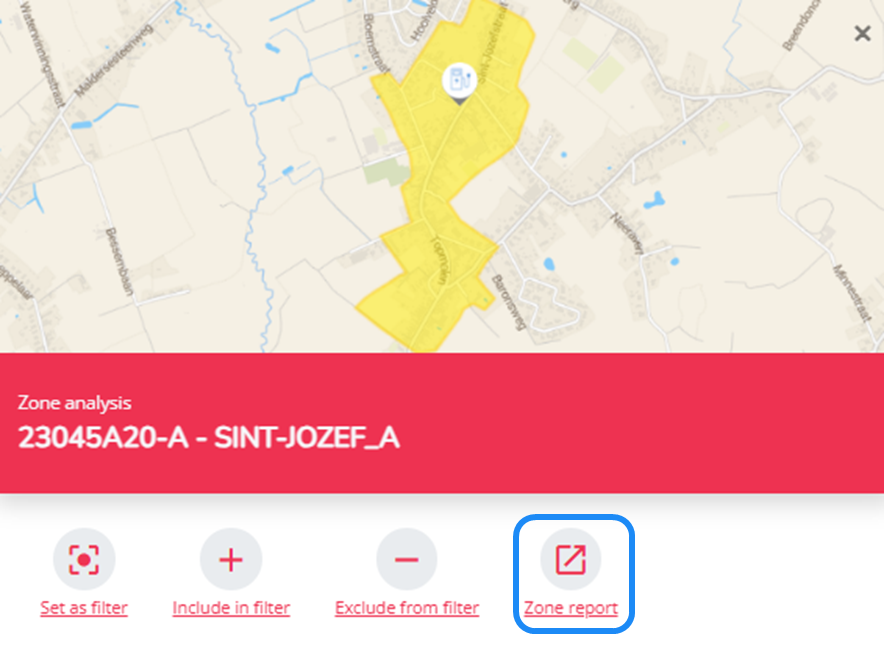
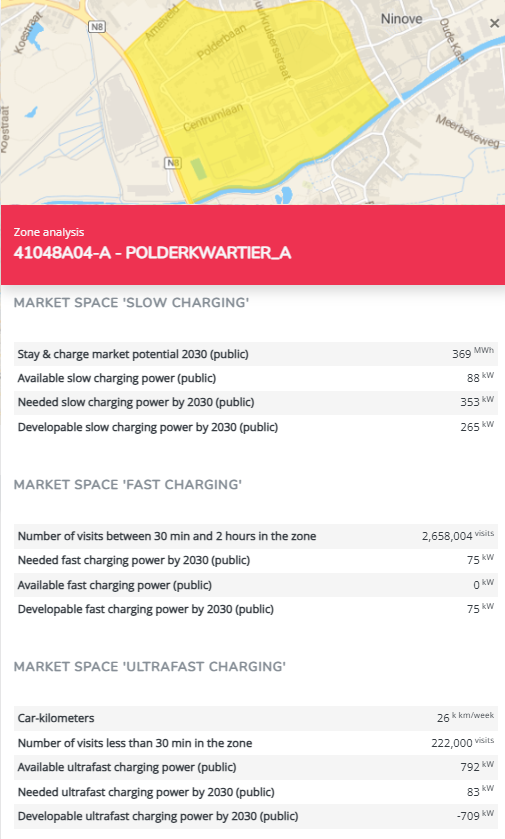
3. Click on an individual zone to see more details
You can always click on an individual zone on the map to see the different elements specifically for that zone.
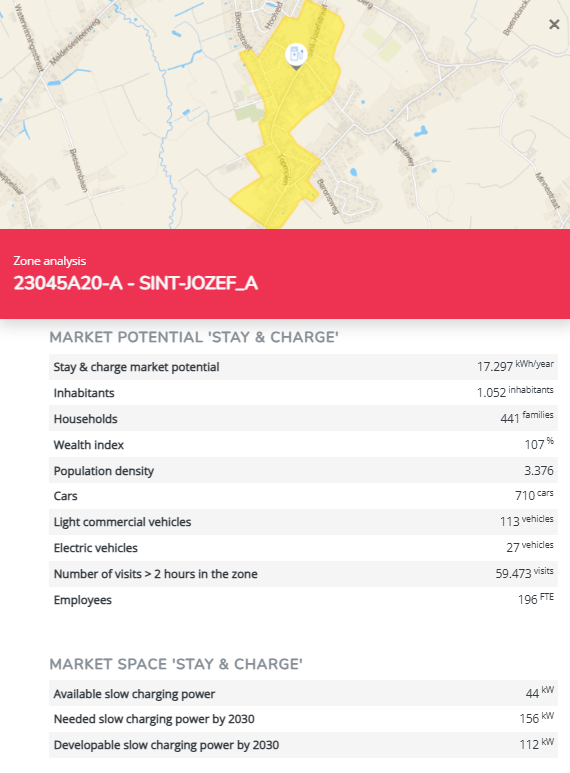
Consult the zone report to see even more details.
4. Make an Excel export
If you want to do further analysis in Excel, you can export all this information.
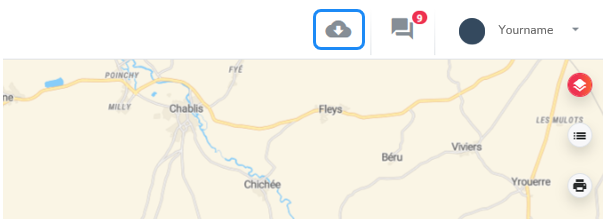
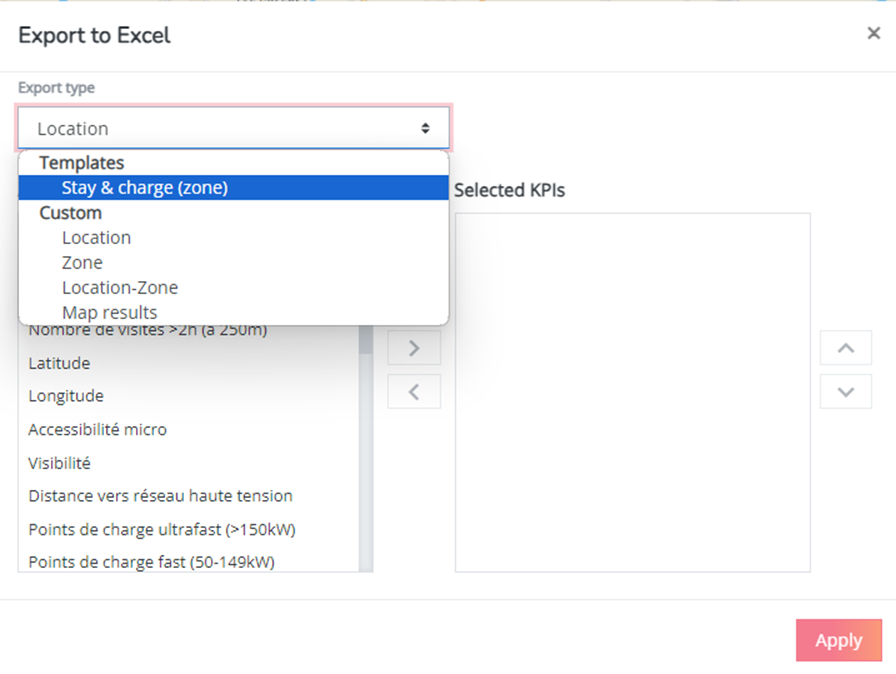
Click on ‘Export to Excel’ at the upper right corner of your application (while still in the Marketing Efforts module).
Select template ‘Stay & charge (zone) & click apply.
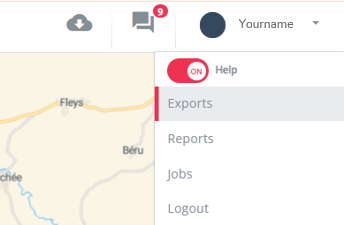
Click on your user on ‘Exports’.
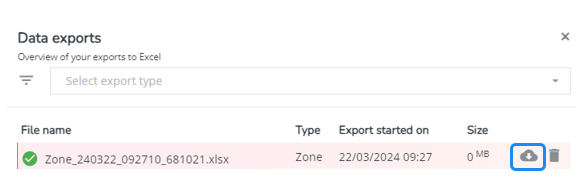
Download the Excel file with information & dive deeper. You can filter on a certain aggregated zone if you want to limit your analysis to a certain geographical area.
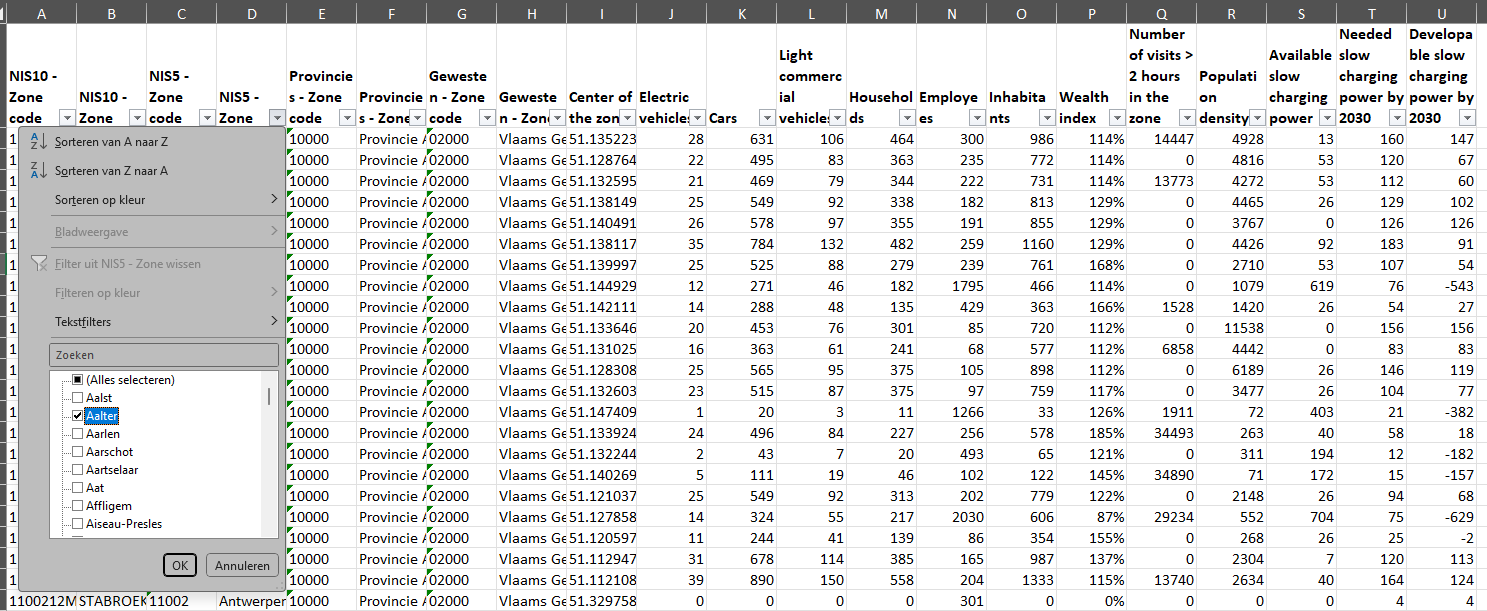
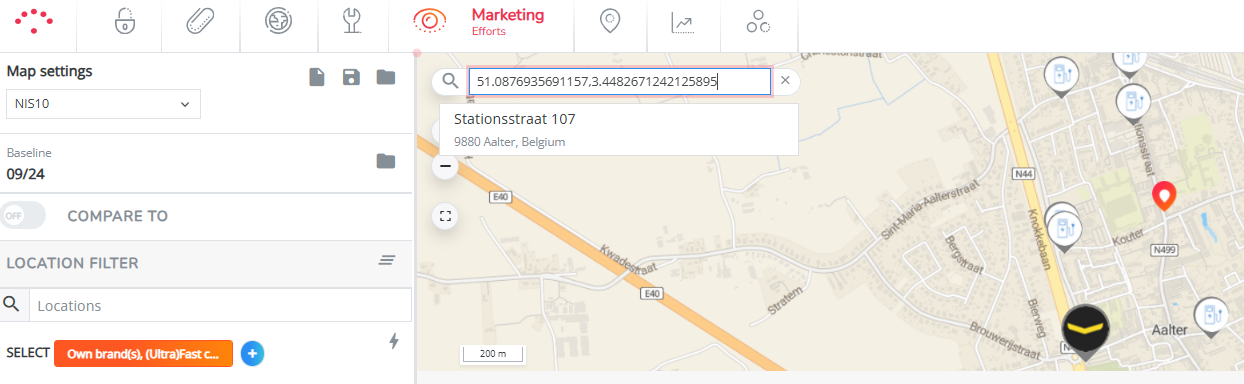
Find your zone easily on the map: The easiest way to do so is by filling in the geographical position with latitude and longitude (that is also exported as a column in the export template) in the searchbar on the map.
Video tutorial
You can also follow the video tutorial below to guide you through the different steps of this process :
II. How to identify the charging needs for 2030 for slow, fast, ultrafast & overnight truck charging? (BE only)
You will find multiple layers within your ChargePlanner application providing insights into the market space for slow, fast, ultrafast & overnight truck charging. In general, the following steps need to be followed:
1. Make sure you see the data you want to see
2. Consult map layers
3. Click on an individual zone to see more details
4. Make an Excel export and analyse further
1. Make sure you see the data you want
- Go to marketing efforts
- Click on 'clear all settings'
- Choose your aggregation level: on which zone level do you want to see the results?
- Select the period for which you want to see the data (typically the most recent data)
2. Consult map layers
- Click on map layers at the upper right corner
Here you see all the relevant layer groups:
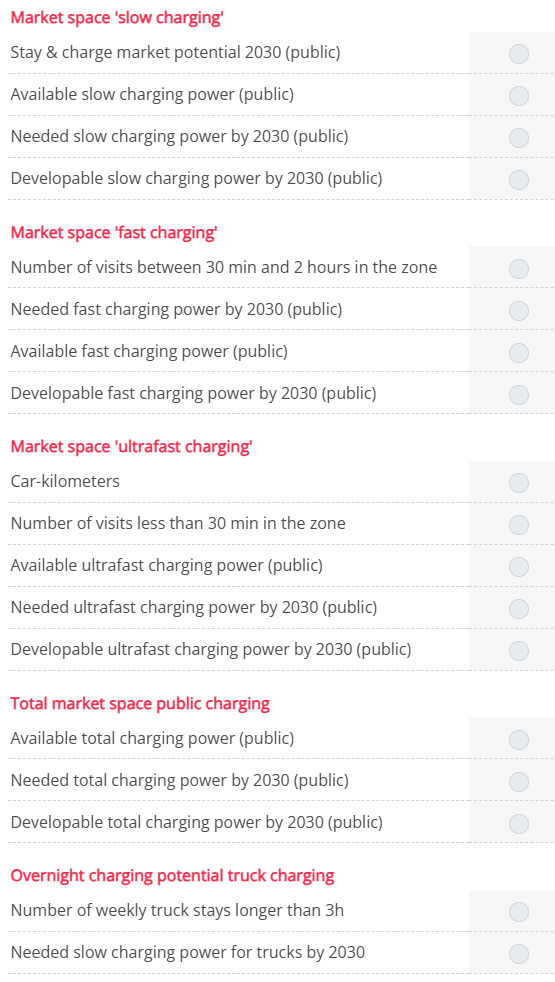
1. Layer groups: Market space 'slow charging', 'fast charging', 'ultrafast charging'
Here you can select the elements that are part of the market space calculation.
‘Developable charging power by 2030’ gives you a map that shows how much charging power can still be developed in each zone for the relevant type of charging.
Remark: Charging needs for ultrafast always need to be analyzed on aggregated level (at municipality level or even more aggregated) and not at individual living block level
2. Total market space public charging
Here you can find the numbers for the market space calculation for all the different charging types together.
3. Overnight charging potential truck charging
This shows deeper insights into the market space calculation for overnight truck charging in specific.
TIP! If you want more information about the details of these calculations, please consult the technical report that was presented and sent to you by our project team
3. Click on an individual zone to see more details
You can always click on an individual zone on the map to see the different elements specifically for that zone.
Consult the zone report to see even more details.
4. Make an Excel export
If you want to do further analysis in Excel, you can export all this information.
Click on ‘Export to Excel’ at the upper right corner of your application (while still in the Marketing Efforts module).
Select template ‘Charging needs for 2030 (zone)' & click apply.
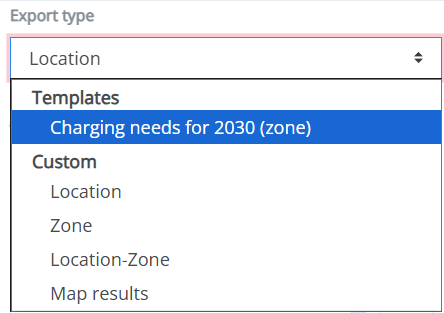
Click on your user on ‘Exports’.
Download the Excel file with information & dive deeper. You can filter on a certain aggregated zone if you want to limit your analysis to a certain geographical area.
Find your zone easily on the map: The easiest way to do so is by filling in the geographical position with latitude and longitude (that is also exported as a column in the export template) in the searchbar on the map.